
Best Economical DVC Resort to Purchase: Spring 2017
At DVC Resale Market we like to keep an economic Disney Vacation Club Resort (DVC) ranking updated for our clients as prices, dues, resorts and Disney can change over time. We started providing this ranking in the Fall of 2014, and this blog represents our 6th in the series.
The chart below will provide a ranking of the Disney Vacation Club resorts in terms of long term value. The long term value considers price, dues and years remaining on the deed to ultimately get to a price per point per year. This ranking may provide directional information in choosing a resort to own, especially for those Members or potential New Members who are less concerned about home resort priority and more concerned about economic value.
Since 2014, Saratoga Springs and Bay Lake Tower have consistently remained #1 and #2 respectively on the economic ranking. Since last year, the top 4 DVC resorts remained the same, and only 4 resorts had their rank position change. All of the DVC Resorts were $7.79 per point per year to $10.47 per point per year. For the full details please see the chart below:

| Resort | Avg. Cost Per Pt. | Years Left | Cost Per Pt. Per Year From Price | Dues Per Pt. | Total Cost Per Pt. Per Year | Rank: Spring 2017 | Rank: Fall 2016 | Rank Change from 2016 to 2017 |
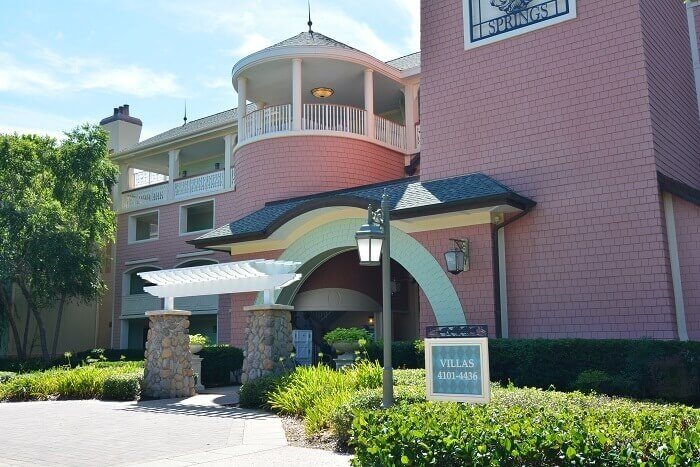
| Saratoga Springs | $81 | 37 | $2.19 | $5.60 | $7.79 | 1 | 1 | — |
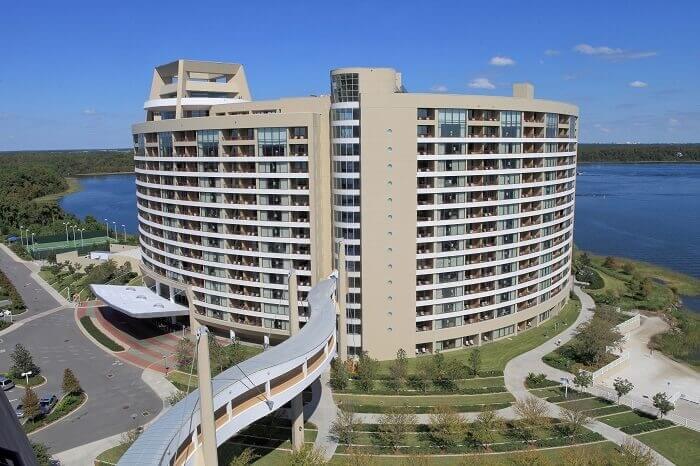
| Bay Lake Tower | $117 | 43 | $2.72 | $5.62 | $8.34 | 2 | 2 | — |
| Old Key West (Extended) | $81 | 40 | $2.03 | $6.41 | $8.44 | 3 | 3 | — |
| Animal Kingdom | $85 | 40 | $2.13 | $6.59 | $8.72 | 4 | 4 | — |
| Grand Floridian | $144 | 47 | $3.06 | $5.90 | $8.96 | 5 | 6 | +1 |
| Grand Californian | $146 | 43 | $3.40 | $5.61 | $9.01 | 6 | 5 | -1 |
| Polynesian | $145 | 49 | $2.96 | $6.14 | $9.10 | 7 | 7 | — |
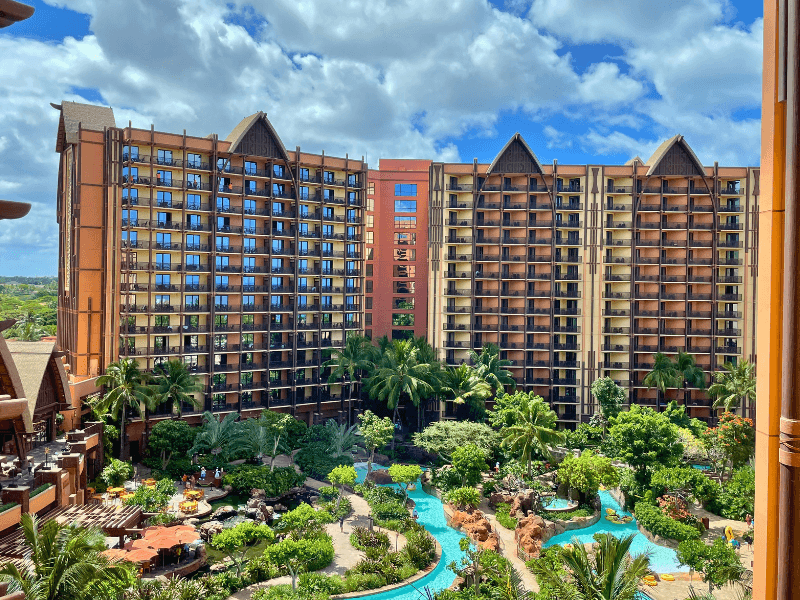
| Aulani | $102 | 45 | $2.27 | $7.03 | $9.30 | 8 | 9 | +1 |
| Old Key West | $74 | 25 | $2.96 | $6.41 | $9.37 | 9 | 8 | -1 |
| Hilton Head | $61 | 25 | $2.44 | $7.27 | $9.71 | 10 | 10 | — |
| Wilderness Lodge | $84 | 25 | $3.36 | $6.54 | $9.90 | 11 | 11 | — |
| Boardwalk | $96 | 25 | $3.84 | $6.47 | $10.31 | 12 | 12 | — |
| Vero Beach | $58 | 25 | $2.32 | $8.11 | $10.43 | 13 | 13 | — |
| Beach Club | $105 | 25 | $4.20 | $6.27 | $10.47 | 14 | 14 | — |
| – Dues per point based on 2017 Calender Year | ||||||||
| – Average cost per point based on average asking price on disneydvcresale.com March ’17 | ||||||||
Additionally, this cost per point per year from the chart above can be used to help determine what a member theoretically pays for a Disney Vacation Club Villa. For example, let’s say you purchased an Animal Kingdom contract and were going to stay at Animal Kingdom in a Savanna View studio for one night on a weekday in Magic Season (includes many Spring Breaks and most of the Summer). The amount of points needed for that one night would be 19, and the estimated cost per point per year according to the chart above would be $8.72. So multiply the number of points needed by the cost per point and the result is 19 x $8.72 or $166/night.
Click to view DVC Resale Market’s current listings


Comments
Are you planning a new analysis since the sudden price jump in June?
Alan, absolutely, we publish a new edition every 6 months due to market trends and annual changes in the dues. Our next edition will be coming out in the next couple of months.
Can you also include data on subsidized Aulani contracts. Just curious how that would effect the order. Thanks
David, historically we have not included the subsidized contracts for Aulani and Vero Beach because they tend to be very uncommon. However, I’m happy to provide the analysis for a subsidized dues Aulani contract. The average cost is roughly $109/pt. (does sell for more per point than a non-sub. Aulani) with 45 years remaining. Putting the cost per pt. per year from the price at roughly $2.42. The dues for 2017 are $5.28/pt. Adding those numbers together puts the total cost per pt. per year at $7.70, which would edge at SSR by 9 cents per point as the best economic option. Typically, the sub. Aulani contracts fall just before SSR or just after SSR when we do this analysis.
Do these take into consideration that points “go further” in some resorts? Like that 76 points will buy you a week in a standard room on off-season at Boardwalk, but will only buy you 5 nights at blt?
Thanks!!
Elizabeth, great question! This analysis does not take into consideration how much you can stretch your points at your home resort. This analysis focuses on which resort is the best to own at regardless of where you are staying. I do have a blog I’m planning, which will include an analysis on the best opportunities to stretch your points.
If you are going to create a long term outlook than you need to also take into account annual dues increase. These numbers are only for this year. And so while helpful don’t give the full picture.
For example, running numbers for Saratoga and holding until the deed expires gives you about a lifetime average of $12.75 per point each year (in 2017 dollars).
*Note this doesn’t take into account present value of money or future value of money which would give you an even more accurate number.
Rob, thank you for your comment and I agree, this provides directional information based on current data to compare the DVC resorts on what is known, not projected. To introduce projections on annual dues and the future value of money would introduce speculation, and while that may be worthwhile for analysis, that is not the intention of this article. Moreover, this is why notations are provided at the bottom of the table to show this is based on 2017 annual dues and prices as of March ’17. However, to your point, since things can change over time we publish an updated version of this blog every 6 months based on current dues and prices as they change. If you are interested in seeing the history of these trends from 2014 to today, please check out our blog archives. Again, thank you for your comment and taking the time to check out our blog.
Thanks for responding Nick! Understand your analysis. I guess my quibble was the following statement: “The chart below will provide … in terms of long term value. The long term value considers price, dues and years remaining … to get to a price per point per year.”
You talk in terms of “long term value” but the costs are only accurate for one year on a 30+ year deal. I know you know this, but many people do not. Have you done a blog post on calculating the actual long term value based on some reasonable assumptions and the future value of money? I would really be interested in reading about that. Anyways, thanks for the blog – I appreciate the monthly ROFR reports!
Rob, I have done a blog titled, “The Long Term Savings of Disney Vacation Club”, which includes a downloadable spreadsheet that can be modified based on speculation in regards to rental discounts and inflationary assumptions. You might enjoy downloading that spreadsheet and exploring various assumptions: https://www.dvcresalemarket.com/blog/the-long-term-savings-of-disney-vacation-club/