
DVC Resale Average Prices for 2018: January – August
This article features the average sales price of contracts categorized by resort and month sold for January through August 2018. Our goal is for this to provide great directional information for anyone considering a DVC resale purchase or just wanting to satisfy a general curiosity of prices and trends.
Keep in mind that prices of a resort can still easily vary based on the size of the contract in points, the current point availability of the contract (i.e., points current, banked and borrowed) as well as other various factors (i.e., extended Old Key West contract, subsidized dues contracts, etc.). For example, contracts that are smaller and have higher point availability tend to sell for more than the average price per point and vice versa.
DVC Resale Price Changes for Walt Disney World (WDW) Resorts
Below is a chart and graph detailing the average prices per point for each WDW DVC Resort, January – August of 2018:
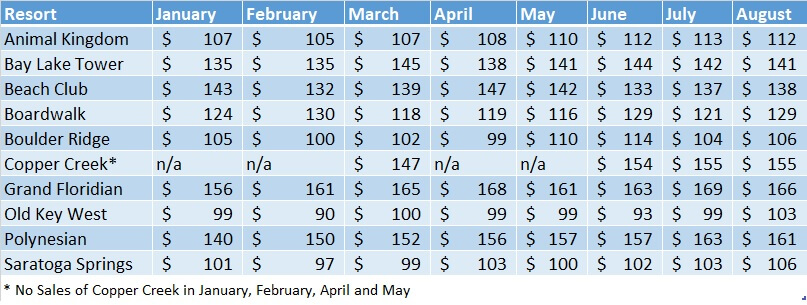
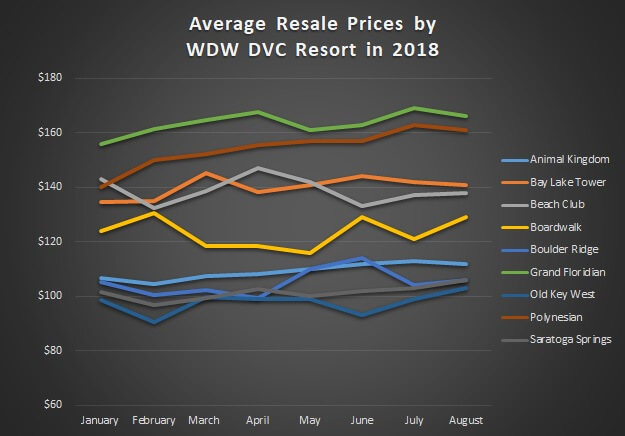
Price consistency for WDW Resorts continued into August. A few WDW resorts have showed modest increases in selling price in 2018: Animal Kingdom, Bay Lake Tower and Grand Floridian.
Selling at $140/pt. in January and at $161/pt. in August, Polynesian is the only WDW Resort with a more than double digit percentage increase in selling price since January.
DVC Resale Price Changes for Non-Resorts
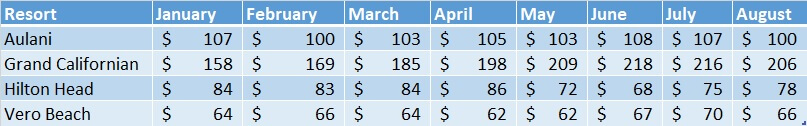
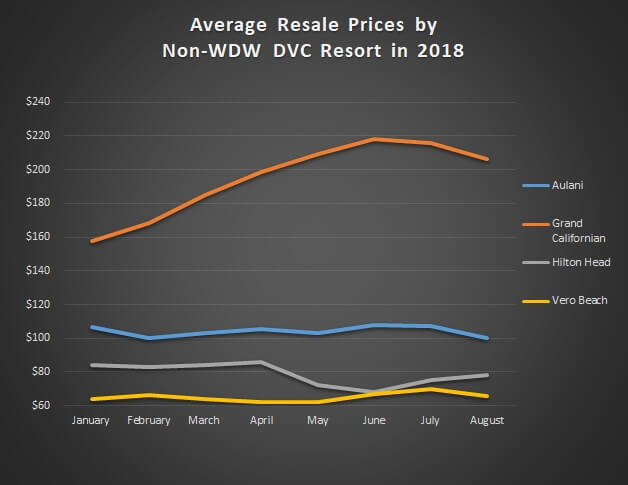
The biggest price change story of any DVC Resort in 2018 has been Grand Californian. Spurred by a $50/pt. direct price increase in January, the resale price of Grand Californian quickly followed, going from $158/pt. in January to as high as $218/pt. in June. With inventory numbers starting to equal demand, and with the resale price within 10% of the direct price, the resale price for Grand Californian began to level off in July.
Then in August we observed a modest dip in average resale price of Grand Californian to $206/pt. However, with Disney hotel space extremely limited at Disneyland, and with progress halted on a new hotel, it is unlikely to see any large decline in value for the Grand Californian anytime soon.
Hilton Head is creeping back up to it’s average selling price to start the year. In August, the average selling price of Hilton Head was $78/pt, which is nearly 15% higher than its low point of $68/pt. in June. Certainly, a high buy back rate has helped encourage the price adjustment for Hilton Head. In July, we observed a buy back rate of 70% and in August a buy back rate of 30% for Hilton Head.
Below is a chart and graph detailing the average prices per point for each Non-WDW DVC Resort, January – August of 2018:
DVC Resale Prices Compared to Direct DVC Prices
Below is a chart comparing the DVC Resale prices to Direct Resale prices:
| Resort | Resale (Based on Aug. ’18 Sales Data) |
Direct* (Disney Vacation Development) |
Difference Per Point (Direct – Resale) |
Percentage Savings with Resale |
| Animal Kingdom | $112 | $171 | $59 | 35% |
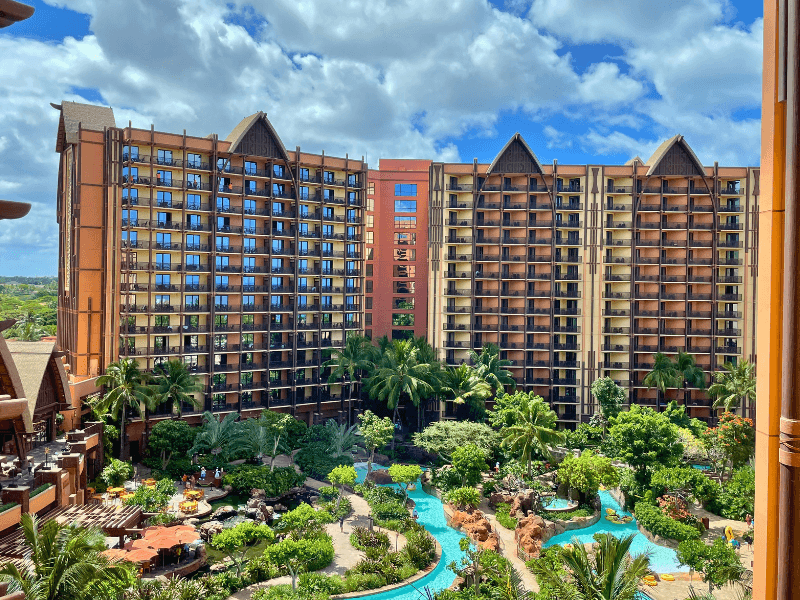
| Aulani | $100 | $182 | $82 | 45% |
| Bay Lake Tower | $141 | $191 | $50 | 26% |
| Beach Club | $138 | $185 | $47 | 25% |
| Boardwalk | $129 | $171 | $42 | 25% |
| Grand Californian | $206 | $235 | $29 | 12% |
| Grand Floridian | $166 | $220 | $54 | 25% |
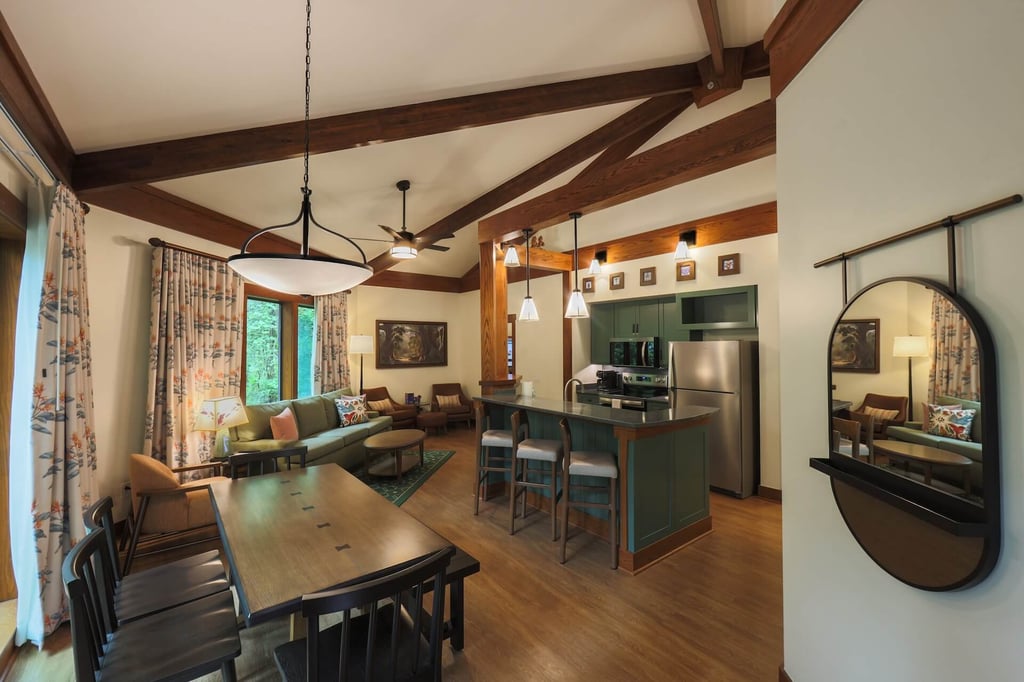
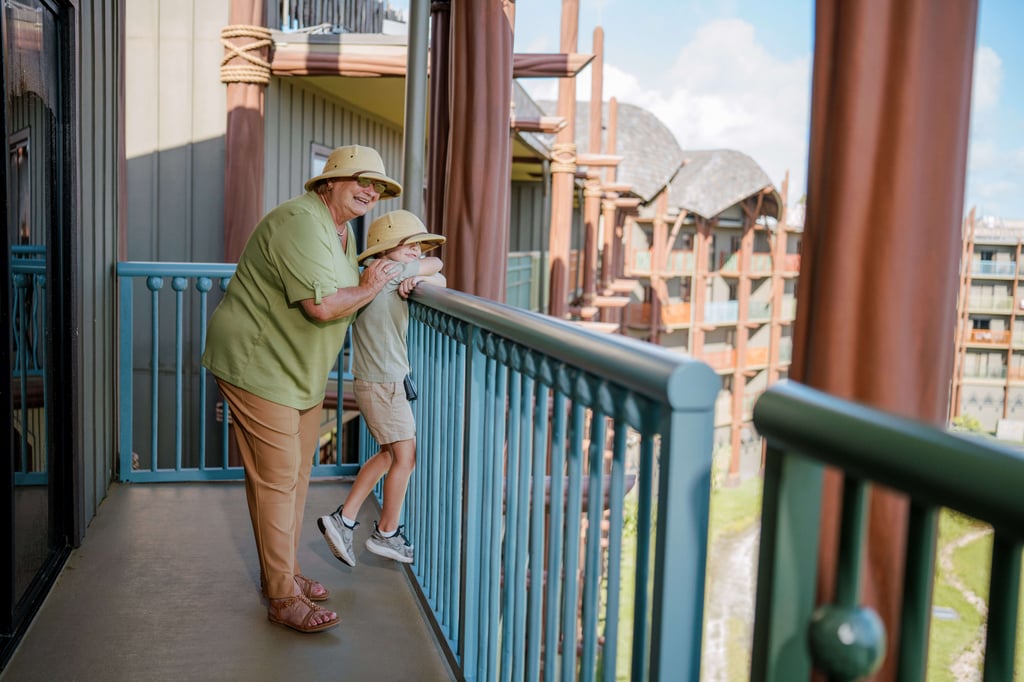
| Hilton Head | $78 | $121 | $43 | 36% |
| Old Key West | $103 | $151 | $48 | 32% |
| Polynesian | $161 | $220 | $59 | 27% |
| Saratoga Springs | $106 | $151 | $45 | 30% |
| Vero Beach | $66 | $100 | $34 | 34% |
| WL: Boulder Ridge | $106 | $171 | $65 | 38% |
| WL: Copper Creek | $155 | $182 | $27 | 15% |
*Direct price does not reflect any promotional discounts DVC may be offering
Access all DVC resale listings and learn more about buying and selling with DVC Resale Market.
Comments