
Let’s Discuss the DVC Point Charts

As you prepare to book your vacations, you’re likely trying to make sense of the DVC Points Chart. Depending on where you reserve a room, you could choose between as many as seven Travel Periods. Each requires a different number of DVC Points to book.
You probably have questions about how the DVC Points Chart works, whether you’ve asked them or not. So, let’s discuss the DVC Points Chart to understand the system’s underlying mechanics.
Why Do We Have the DVC Points Chart?
During the last two weeks of 2023 and the first week of 2024, Disney Genie+ was listed for its highest price ever. On several dates, multiple versions of the digital queuing service sold out. In one instance, Disney Genie+ sales closed before the park even opened.
What does that have to do with the DVC Points Chart? Obviously, the parks claimed unprecedented attendance levels during the holiday period. DVC understandably must ask its members to spend more of their DVC Points for hotel stays at this time of year. Management would fail with the basic economics of supply and demand if the DVC Points cost were the same.
Similarly, Disney has spent the body of the 21st century killing an archaic term, the “offseason.” In particular, Walt Disney World doesn’t really have one of those today. Since the 2017 addition of the EPCOT International Festival of the Arts, even January hasn’t slowed down the way that it once did.

Courtesy of WDWNT
Disney has seeded the slower months of the year with events that drive attendance. For example, the other presumed slow month on the calendar, September, now features many Mickey’s Not-So-Scary Halloween Party dates. Universal’s Halloween Horror Nights also attracts DVC members.
From the big-picture perspective, you won’t find a slow season at Disney now. Instead, choosing when to visit involves a matter of degrees about when are the best and worst times to visit.
You should pay more DVC Points for Spring Break and national holidays. That’s just common sense. However, the DVC Points Chart reveals more than just the obvious dates.
Let’s Dig Deep into the DVC Points Chart

Courtesy of Disney Tourist Blog
Let’s use Disney’s Beach Club Villas for this discussion. I’m choosing this property because it covers the largest number of Travel Periods, which is currently eight.
Here are a few conclusions we can draw from the listing. The first is that even after Disney has balanced the calendar, September remains the slowest season. You can and should continue to take advantage of this fact if possible.
Yes, the start of the academic year causes scheduling problems, but a Studio costs 14 percent less in September than during Travel Period 3. We’re talking about 114 DVC Points for a week in Travel Period 3 as opposed to 100 DVC Points in September. Those savings add up.

2024 Beach Club Villas Point Chart – Period 3
Similarly, DVC continues incentivizing guests to visit during January and the first half of May. While the Festival of the Arts has unquestionably heightened demand in January, Disney prefers that to people spending their DVC Points in the summer or during holidays.
We can tell this fact by studying Travel Period 4. Please note the start date for this middle section of the DVC Points Chart. Disney doesn’t begin the season on June 1st, as kids are still in school then. Instead, the season lasts through June 10th.
Disney is telling members to travel before schools go on their summer breaks. On June 11th, the DVC Points Chart increases prices slightly to reflect the start of the summer season. Notably, late June has proven more crowded than July lately, but DVC hasn’t reflected that yet.

2024 Beach Club Villas Point Chart – Period 4
Here Are the Priciest Parts of the Chart
Finally, we have the part of the DVC Points Chart that’s easiest to understand. You don’t need to know much about the travel industry to recognize the most popular travel dates.
During the weeks of national holidays, tourists head to their favorite destinations, one of which is Walt Disney World. Not coincidentally, Travel Periods 6 and 7 include three major holidays: Thanksgiving, Christmas, and New Year’s.
Disney tosses Easter and Spring Break into the mix since those are also popular travel dates. But the numbers reinforce just how dramatic the difference is. Spending a week at Beach Club around Thanksgiving costs 34 percent more than in September.

Courtesy of Disney Tourist Blog
Then, we get to late December, and the numbers are jaw-dropping. DVC members desire a Disney vacation so much this time of year that the Points Chart spikes. That week, which costs 134 DVC Points at Thanksgiving, requires 191 DVC Points in December!
To a larger point, a week at Beach Club during Christmas Week costs 91 percent or 91 DVC Points more than during September. Disney builds the entire system around these two timeframes.
The DVC Points Chart reflects the dramatic change in demand for that holiday period as well as Easter. And that’s the crux of the DVC Points Chart.
Once you examine all sections of it, you can decipher Disney’s intent with the scheduling. The system drives you to certain dates of the year, but it’ll happily accommodate you anytime, if you’re willing to pay more for those more popular times on the calendar.
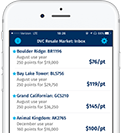
Access all available Disney Vacation Club resale listings, or learn more about buying and selling with DVC Resale Market.


Comments